

Why zones matter
Most runners do their easy days too hard and their hard days too easy. Everything drifts to the middle: tiring enough to need recovery, not hard enough to make you faster. You cannot feel this happening. You can see it in your heart rate.
What you see in Kiiro
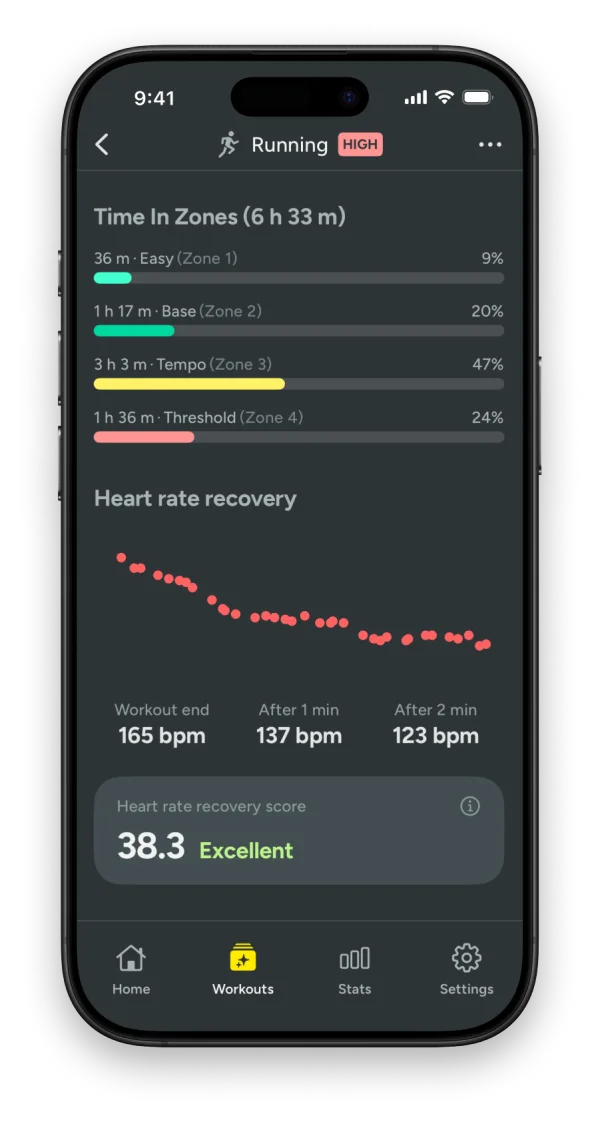
- Time in zones for every workout, so you know what a session really was.
- Intensity: how your recent training splits between low, medium and high, the quickest check of whether easy days stayed easy.
- Zone trends across weeks and months, to see where your training time goes.
How the zones are set
Kiiro uses five zones. By default they are percentages of your maximum heart rate:
| Zone | % of max heart rate | Feels like |
|---|---|---|
| Zone 1 | up to 60% | Very easy. Warm-up, cool-down, recovery. |
| Zone 2 | 60–70% | Easy. You can hold a conversation. |
| Zone 3 | 70–80% | Steady. Talking in short sentences. |
| Zone 4 | 80–90% | Hard. Around threshold, a few words at a time. |
| Zone 5 | over 90% | Very hard. Short intervals only. |
Percentages of maximum heart rate are a starting point, not a verdict. If you know your own boundaries, set them and every chart updates to match. The heart rate zone calculator gives you these five zones in beats per minute.
Your watch has its own zones, set separately. See how Apple Watch sets heart rate zones and how to change them.
Zones and training load work together
Zones tell you how a workout was spent. Training load tells you what all your workouts add up to. A week can look balanced on load and still be all middle-zone running; Kiiro shows you both.